
Power Query Split to Rows Inflates Totals: Separate Tags from Money
Split multi-value tags into rows without duplicating invoice totals. Choose membership or allocation and reconcile every invoice.
Published November 18, 2026

If splitting a Power Query column into rows increases your invoice or project-cost total, stop summing the copied amount column. The split has changed what one row represents. A row may now mean “this invoice has this tag” rather than “this is one invoice.” Keep the original financial table intact, and decide whether the expanded table represents membership or an approved allocation of money before rebuilding the report.
This guide is for finance and operations analysts handling exports with several departments, projects or categories in one cell. It fits a field such as “Operations;Sales” attached to one invoice. Skip an automatic equal split when the business has not approved how to allocate the cost. A delimiter tells the software where text separates; it does not tell the analyst who should bear the expense.
The split worked, but the measure changed
Microsoft's Split columns by delimiter guide documents splitting each occurrence into rows through the advanced options. A delimiter is the character separating values, such as a semicolon. The operation produces more rows while retaining the table's columns. That is useful for a list of relationships, but it makes a previously additive invoice amount dangerous to sum without further design.
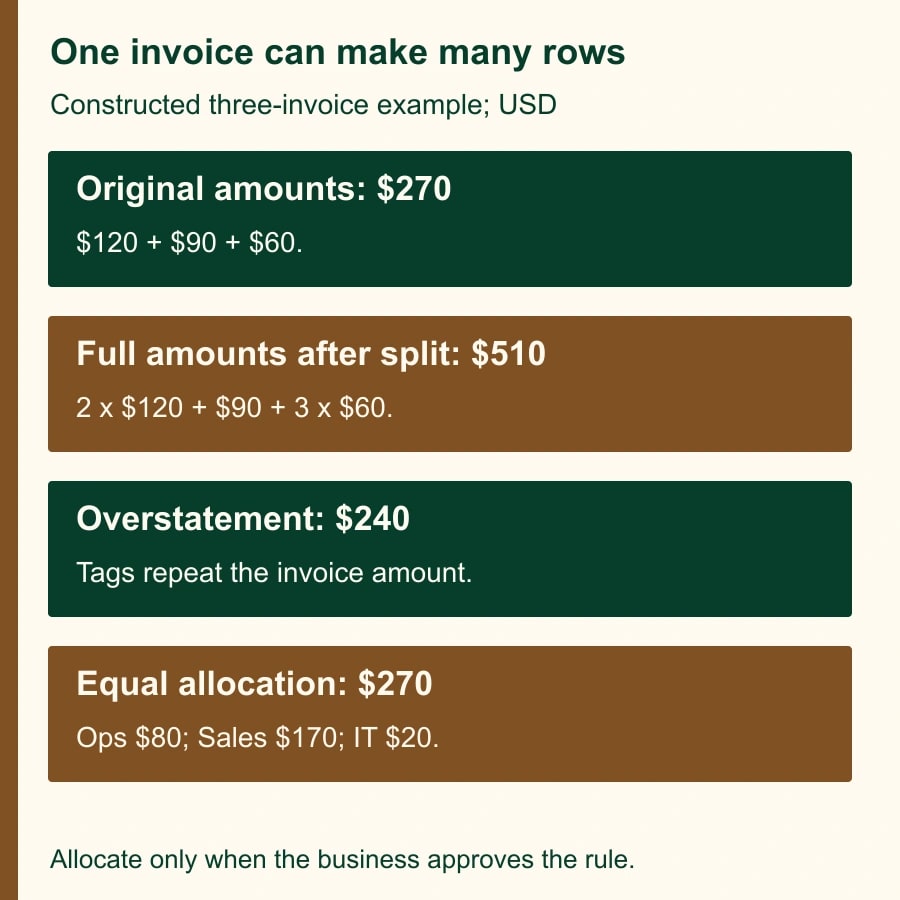
Consider a constructed three-invoice example. Invoice I01 is $120 and has the tags Operations and Sales. I02 is $90 and has Sales only. I03 is $60 and has Operations, Sales and IT. The original invoice total is $270. Splitting the tag field produces six invoice-tag rows: two for I01, one for I02 and three for I03.
If the full invoice amount travels onto every expanded row, summing it produces $510: two times $120, plus $90, plus three times $60. The increase is $240. Nothing new was purchased. The report has counted memberships as though each were an independent financial transaction. The split is not a rounding problem, and changing the number format will not repair it.
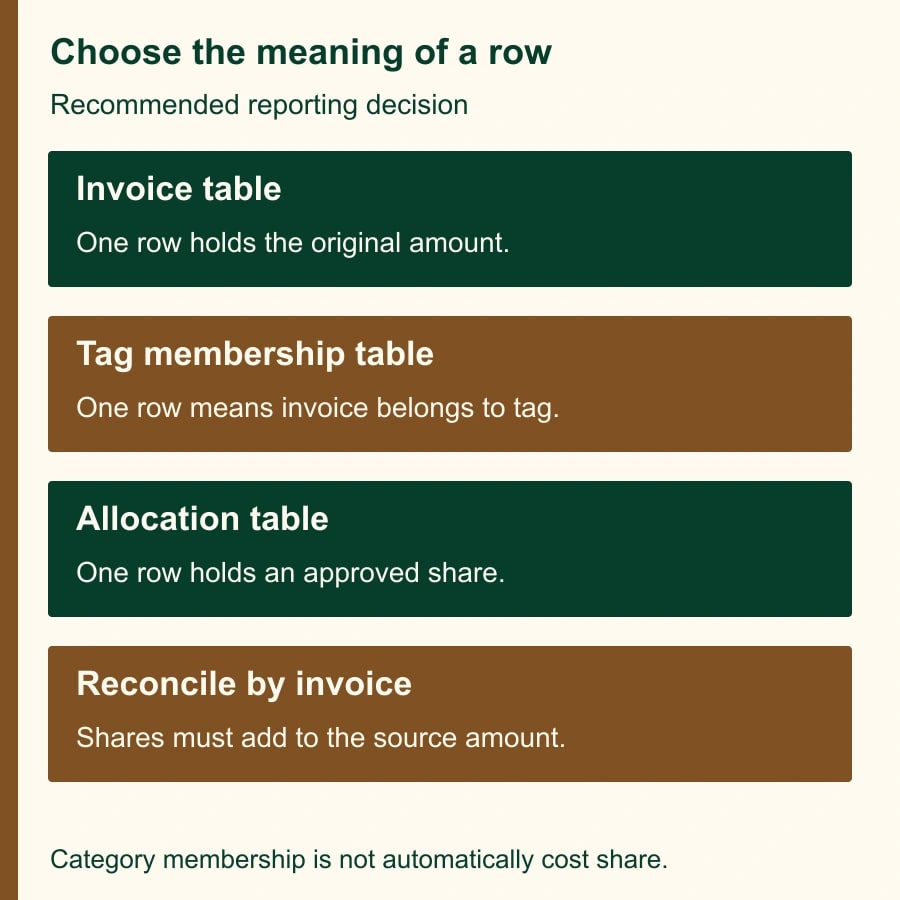
The first diagnostic question is therefore: “What does one output row mean?” Write the answer in the report specification. If it is an invoice-tag relationship, name the table accordingly and avoid presenting its repeated invoice amount as a category allocation. If it is an allocated expense, each row needs an approved share and an amount calculated from that share.
Preserve the invoice table before expanding categories
Save a recoverable copy of the workbook or report and retain the unchanged source export. Record the query, refresh time and last distributed report. If an inflated total has already reached managers, identify the affected period and categories so they can hold decisions while you investigate. Do not quietly replace the workbook and leave readers unaware that their earlier figures were wrong.
Inspect Applied Steps in Power Query Editor. Select the step immediately before the split and record the row count, unique invoice IDs and amount total. Then select the split step and inspect those measures again. The expected row-count increase should follow the number of category memberships. The authoritative financial total should still come from the original invoice-level data.
Use a stable key appropriate to the source. If an invoice contains several legitimate lines, InvoiceID alone is not enough to identify a financial row; use the invoice-line key or the actual business key. Otherwise, a later attempt to remove duplicates can collapse real line items. Establish the original level of detail before trying to preserve it.
Keep a dedicated invoice or invoice-line query and create the category expansion as a separate query under the team's normal workflow. Name the outputs to show their purpose, such as InvoiceAmounts and InvoiceCategoryMembership. That small naming decision prevents the next analyst from treating two tables with different meanings as interchangeable sources for a financial total.
Choose membership or allocation deliberately
A membership table answers questions such as “Which invoices involve Sales?” or “How many unique invoices touch IT?” It can legitimately place the same invoice in more than one category. For the sample, Operations has I01 and I03, Sales has all three invoices, and IT has I03. The category counts are two, three and one; adding them gives six memberships, not six unique invoices.
Full invoice amounts can sometimes support a clearly labeled “value of invoices involving this category” view. In the sample, Operations is associated with $180, Sales with $270 and IT with $60. Those amounts overlap. They must not be added to produce a company total or described as allocated departmental expense. The same invoice can be relevant to several teams without being charged several times.
An allocation table answers a different question: “How much of this invoice belongs to each category?” It needs a policy. Possible policies include equal shares, recorded usage or a separately approved percentage. The analyst implements that policy; the budget or cost owner approves it. Do not hide a new allocation decision inside a data-cleaning step.
For a simple report, keeping two outputs may be clearer than building a complicated calculation. Use the original table for company totals and the relationship table for category filtering or review lists. If readers need additive category amounts, build the allocation explicitly and label it. Complexity should follow the business question, not the convenience of the export format.
Work the equal-share example through to the total
Assume the business owner approves equal allocation across distinct valid tags for this illustration. I01 has two tags, so allocate $60 to Operations and $60 to Sales. I02 has one tag, so allocate all $90 to Sales. I03 has three tags, so allocate $20 each to Operations, Sales and IT. The six allocated rows still total $270.
The category totals become Operations $80, Sales $170 and IT $20. Check both directions: each invoice's allocated rows must sum to its source amount, and all category amounts must sum to the source total. The company-level equality alone is insufficient because offsetting allocation errors can cancel out. One invoice could be overallocated by $10 while another is underallocated by $10.
The tag count used as a divisor must reflect the approved rule. If “Sales;Sales” is a duplicated membership, equal allocation across distinct tags should not treat Sales as two separate beneficiaries. If the repeated entry represents two real units of usage, then it is not merely a tag list and the data model needs to preserve that quantity explicitly. Resolve the meaning before counting.
Blank and unknown categories need a policy too. Do not let an invoice disappear because its category field is empty. Hold it as an exception or allocate it to an explicitly approved Unassigned category. If the report excludes those exceptions from its category chart, show the excluded amount and reconcile it to the full financial total.
When the shares are unequal
Now suppose the owner decides I01 should be 75 percent Operations and 25 percent Sales based on documented usage. Its allocation becomes $90 and $30. Leave I02 and I03 unchanged. Operations now totals $110, Sales $140 and IT $20, still totaling $270. This change is a revised business allocation, not a different way to clean the same text.
Store the approved weights with the relevant invoice or allocation rule. Check that the weights for each source financial row sum to 100 percent, are nonnegative and refer to valid categories. Preserve the approval date and effective period. A revised rule for next month should not silently rewrite last quarter's published departmental costs unless that restatement is intended and approved.
Rounding requires another explicit choice. A $100 invoice divided equally among three categories cannot produce three identical amounts to the nearest cent while retaining the total. One possible approved result is $33.33, $33.33 and $33.34. Assign the remaining cent using a stable, documented rule rather than whichever row happens to appear first after refresh. Different businesses may choose different policies.
Keep the unrounded calculation where useful for review, but reconcile the amounts actually reported. A worksheet that proves an unrounded total while distributing rounded numbers can still be wrong at the final output. Test positive amounts, credits and small values under the selected policy before using it for a full period.
Implement the split with a small acceptance fixture
In the repair copy, select the multi-value category column and use Split Column, By Delimiter. Choose the delimiter used by the source, each occurrence, and Rows under the relevant advanced options. Microsoft notes that the dialog differs between desktop and online versions, so use the named options rather than assuming the layout is identical. Confirm the preview before loading the result.
Use the three-invoice fixture first. Retain the original identifier on every expanded row and inspect the six expected invoice-category pairs. Then add a blank category, a duplicate tag, an unknown tag and a category name containing the proposed delimiter. A semicolon inside a valid name makes the source format ambiguous unless it has an agreed escaping convention. Ask the source owner to resolve that ambiguity rather than guessing.
For allocation, calculate or attach the approved shares before presenting additive amounts. Keep the source amount and allocated amount clearly distinguished in the review output. Avoid a report with two columns both labeled Amount. A reader should know which can be summed across expanded rows and which is repeated only for traceability.
Microsoft's Group By documentation describes grouping on one or more columns and calculating sums or counts. Use an appropriate grouped check to compare each financial key's allocated total with its source amount. Grouping is a reconciliation aid, not a cure for an undefined key. Summing repeated full amounts simply reproduces the error at a higher level.
Why removing duplicates is often the wrong repair
Removing duplicate invoice IDs from the expanded table may restore the company total while deleting category relationships. If I01 keeps only Operations, Sales loses a legitimate association. If the retained category changes with source order, the report becomes unstable. A plausible total can conceal a different defect introduced by the attempted fix.
Likewise, dividing every row by a single global average tag count will not preserve each invoice. The sample has one, two and three memberships. A divisor of two may look reasonable across six rows, but it does not express the policy for each source record. Count or weight the memberships at the financial key where the allocation decision belongs.
Trace later joins as well. A category lookup containing two rows for Sales can multiply the already expanded records again. Check row counts and totals after each operation that can change the number of rows. The split may be the first visible jump, while a duplicate mapping key creates the second. Repair the entire path to the published measure.
Release a report whose totals have one meaning
- Source: preserved export, financial key, original row count, source total and reporting period.
- Expansion: delimiter, valid category list, expected memberships, duplicate-tag and blank-category policies.
- Measure: membership count, overlapping associated value, or approved allocated amount; state which one the report uses.
- Reconciliation: expected pairs, per-key allocated totals, category totals, exceptions and post-join checks.
- Approval: allocation owner, query maintainer, corrected report recipients and next-refresh observation.
This repair usually uses the existing Power Query environment. Its main cost is analysis, approval of the reporting rule and correction of any decisions based on the inflated result. Measure success by reconciled financial keys, explained exceptions and stable refreshes. A shorter cleanup process releases capacity; it does not automatically reduce the budget.
Stop distribution if the original financial key is unknown, the source cannot be recovered, allocation weights lack an owner, or unexplained differences remain. Start by reproducing the $270-to-$510 example and identifying which meaning your report needs. If a join is multiplying the rows, continue with the Power Query merge-duplicate diagnostic. If the source is a wide monthly export, the unpivot completeness guide addresses that separate transformation.
Weekly Newsletter
AI Adoption Weekly
New research, field guides, training studies, and tool decisions for operators.
No spam. Unsubscribe anytime.
Related Comparisons
Calculator
AI seat cost calculator
List price × headcount. You enter the hours and the operating assumptions.