
Looker Studio Lead Totals: Count Unique IDs, Not Chart Rows
Reconcile unique lead totals with a six-row example. Separate activity rows, channel memberships and COUNT_DISTINCT before changing your report.
Published November 21, 2026

If a Looker Studio total is smaller than the sum of the unique leads shown for each channel, the chart may be correct. One lead can belong to more than one channel while counting only once in the overall total. Recalculate unique IDs over the full filtered set before trying to make the total equal the visible rows. Adding channel-level distinct counts answers a different question.
This guide is for marketing operations analysts who have a usable lead identifier and need to explain a report to a sales or finance colleague. It fits raw lead or activity data in which the same identifier can appear repeatedly. Skip the formula repair if the source contains only already-aggregated totals or if no one can define what one lead means. You need to settle that definition before a chart can give a defensible answer.
Google defines COUNT_DISTINCT as counting unique items and distinguishes it from COUNT, which includes duplicates. Its current documentation also restricts applying these functions to already-aggregated metrics. The examples below use a constructed six-row dataset, not customer results. Documentation was checked November 21, 2026. Google's COUNT_DISTINCT reference and COUNT reference
Decide what the number is supposed to count
Start with the sentence the report is meant to support. “Four distinct leads appeared in the selected period” describes people or records identified by an agreed key. “Five channel memberships appeared” describes associations between leads and channels. “Six activity rows were imported” describes source records. All three can be true at the same time.
An identifier, or ID, is the field used to recognize the same entity across records. A lead ID should identify the business object you intend to count. An email address may change or be shared; a row number usually identifies an imported row rather than a lead. Ask the source owner what the field represents instead of choosing the column that happens to look unique in a small sample.
You need access to the underlying records, the report's date and filter settings, and someone who can approve the lead definition. The work can usually begin in a copy of the report with a small test source. Budget analyst and reviewer time; the method does not require purchasing another reporting tool or assume a particular connector's price.
Reproduce the issue with six rows
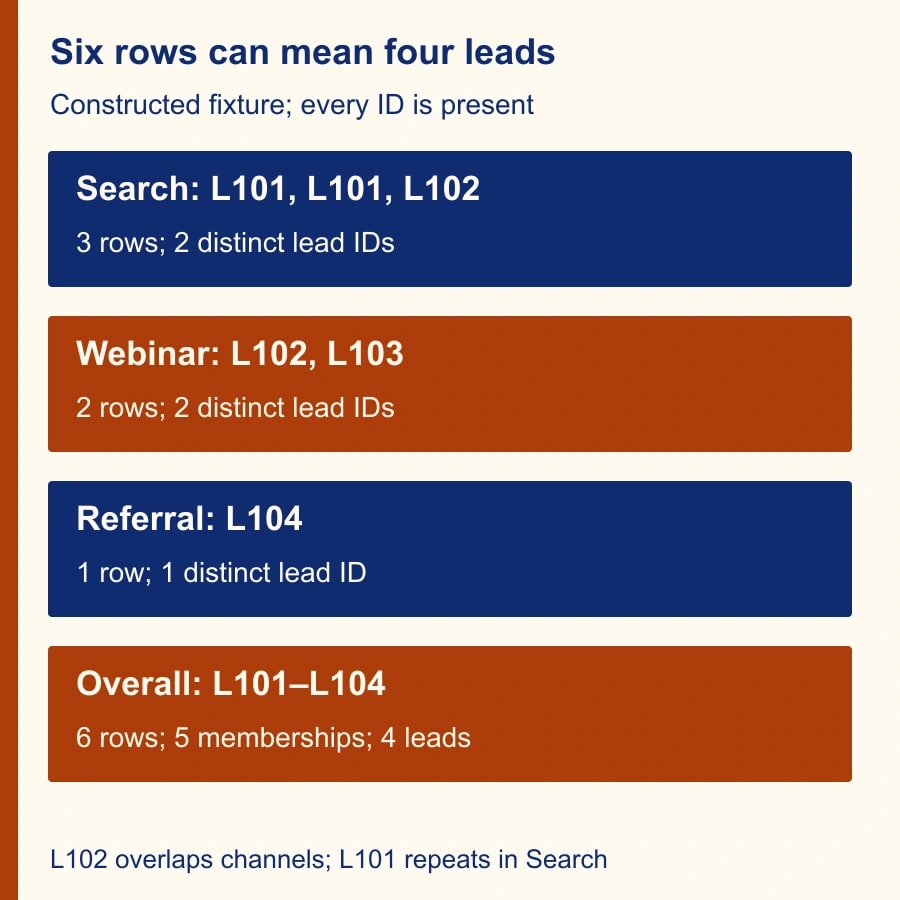
Create a harmless test sheet with three fields: row number, LeadID and Channel. Enter the following constructed records exactly. Every LeadID in this example is present and nonblank, so the arithmetic is not affected by missing identifiers.
- Row 1: L101, Search.
- Row 2: L101, Search.
- Row 3: L102, Search.
- Row 4: L102, Webinar.
- Row 5: L103, Webinar.
- Row 6: L104, Referral.
There are six source rows. The unique IDs are L101, L102, L103 and L104, giving four distinct leads. Search contains L101 and L102, so its distinct count is two. Webinar contains L102 and L103, also two. Referral contains L104, giving one. Adding those channel counts produces five, because L102 appears in both Search and Webinar.
The second Search row for L101 is a different kind of repetition. It increases the row count but does not increase Search's distinct lead count. Removing that repeated activity would reduce the source to five rows while leaving the four-lead total unchanged. Do not confuse repeated activity within a channel with one lead legitimately appearing across channels.
Build separate checks for rows and leads
In a test copy, create a table with Channel as the dimension and LeadID counted distinctly as the metric. A dimension groups records; a metric calculates a value for each group. Then create a separate scorecard for the overall distinct LeadID count with the same source and filters. The expected constructed results are Search 2, Webinar 2, Referral 1, and overall 4.
Use a separate diagnostic count for the six nonblank LeadID entries. COUNT(LeadID) and COUNT_DISTINCT(LeadID) are intentionally different here. Google's documentation supports choosing distinct counting as an aggregation or using the function on an appropriate field. Avoid wrapping a metric that is already aggregated inside another distinct-count calculation. Supported distinct-count inputs and aggregation
Do not promise that a particular total-row setting will behave identically across every chart and connector. Inspect what your chart actually computes and compare it with the standalone scorecard. A total that recomputes unique IDs over the full source set should give four in this fixture. A value produced by adding the three displayed channel counts gives five and needs a different label.
The reviewer should be able to recover the four IDs from a detail view. A scorecard alone is difficult to audit. Keep a temporary record-level table while diagnosing the report, then remove or restrict it appropriately before sharing if it exposes data that the audience should not see.
Explain why the total does not add up
Use this plain-language note beside the report: “A lead can appear in more than one channel. Each channel counts that lead once within its group; the overall total counts the lead once across all selected channels. Channel counts therefore should not be added to obtain total unique leads.” Adapt the wording to your actual definition and verify that it matches the data model.
For the constructed fixture, Search's two leads plus Webinar's two leads represent three different IDs, because L102 belongs to both. Adding Referral's one new ID produces four. The overlap is the reason the arithmetic differs, not a rounding error. Rounding settings cannot repair or explain this distinction.
If a stakeholder requires channel totals that add to the overall lead count, you need an allocation rule. For example, the business might assign each lead to one approved primary acquisition channel. That is a different reporting model from counting every channel in which the lead appears. The marketing owner should approve the rule, its date basis and how missing or conflicting attribution is handled.
Do not silently choose the first visible row as the primary channel. Sort order can change without the underlying business facts changing. Similarly, replacing a distinct count with a simple sum may make the display look consistent while altering what it measures. A cosmetic reconciliation is not a data-quality repair.
Check filters before changing formulas
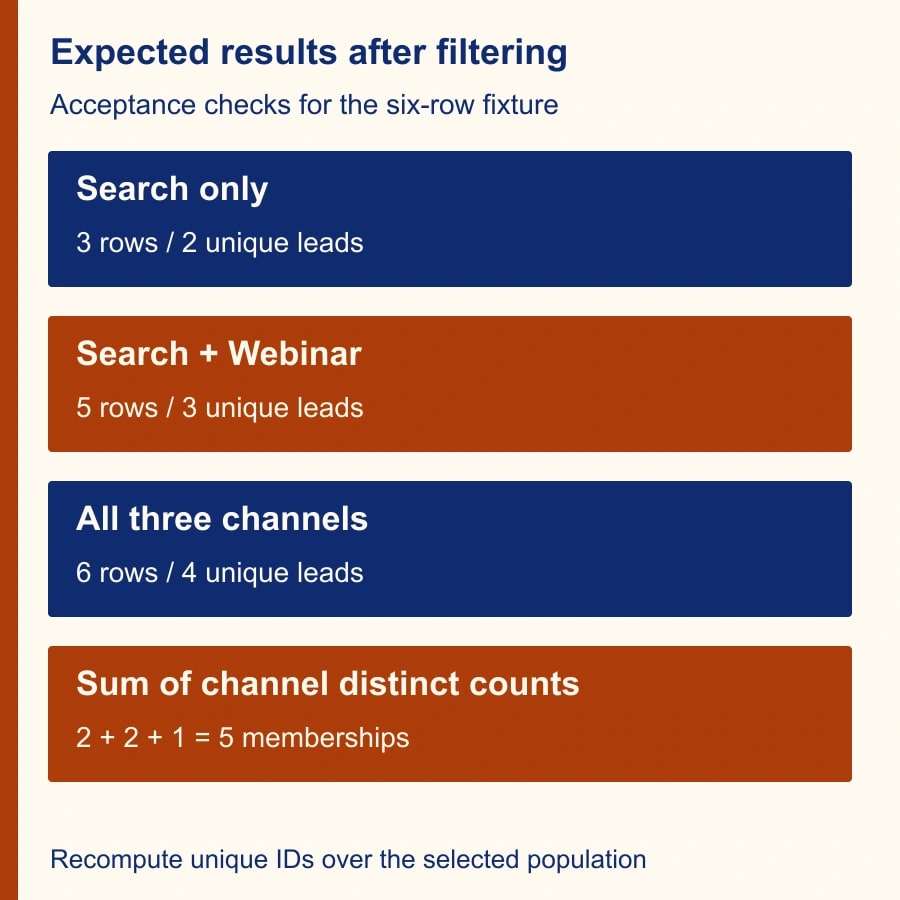
Apply a channel filter to the fixture. Search alone should show three source rows and two distinct leads. Search plus Webinar should show five rows and three distinct leads. All three channels should show six rows and four distinct leads. These small expected results make it easier to detect a filter applied to one component but not another.
Then compare the date range, selected accounts, qualification status and any exclusions in the real report. A channel table limited to qualified leads cannot be reconciled directly with a scorecard containing all leads. Write the filter scope next to each test result rather than relying on what the dashboard appears to show.
Dates deserve their own decision. A lead-created date and an activity date answer different questions. A person created last month but active this month may belong in an activity report and outside this month's new-lead report. The formula cannot decide which interpretation the business intended.
Keep the comparison on a single known source while debugging. If the report combines multiple sources, temporarily isolate the lead records from the blend. A blend joins data from different tables; duplicated matches can increase row counts or alter other metrics. Distinct counting may conceal some repetition without fixing the underlying join or making revenue and cost calculations correct.
Investigate identifiers that only look identical
Inspect a small sample of IDs that appear duplicated or unexpectedly separate. Check the source values, not just shortened labels in the chart. Leading or trailing spaces, different capitalization, formatting conversions and missing values can change what your data system treats as identical. Exact behavior depends on the connector and underlying system, so verify it with controlled examples rather than assuming one universal rule.
If normalization is needed, document it at the source or in a clearly named field. Normalization means converting equivalent representations into a consistent form. It should preserve the identity the business actually uses. For example, trimming accidental whitespace may be appropriate, while removing meaningful leading zeros from an account identifier may merge different records.
Never substitute a single placeholder such as UNKNOWN for every missing lead ID and then describe the result as a count of people. A shared placeholder can collapse many unidentifiable records into one distinct value. Report missing identifiers separately and ask the source owner to repair them. Excluding them from a measured total may be reasonable, but the exclusion must be visible.
If the source contains only a daily count of unique leads, adding those daily counts cannot reconstruct a monthly unique population when the same lead appears on several days. You need identifiers or a source calculation that can deduplicate over the required period. Google's restriction on re-aggregating certain metrics is one practical warning against treating every numeric field as raw data. COUNT input restrictions
Use this reconciliation worksheet
Create a short worksheet before changing the production dashboard. Its purpose is to let a second person reproduce the conclusion and understand which business decision remains open.
- Business definition: What counts as a lead, which ID identifies it, and who approves that definition.
- Scope: Date field, date range, channels, qualification filters and excluded records.
- Source check: Number of imported rows, number with usable IDs and number needing repair.
- Unique check: Overall distinct IDs, distinct IDs within each channel and known overlaps.
- Display check: What the table, total row and standalone scorecard each calculate.
- Attribution decision: Whether leads can belong to several channels or must be assigned to one approved primary channel.
- Acceptance evidence: Small test inputs, expected results, observed results, reviewer and date.
For the six-row example, the worksheet records six usable rows, four unique leads and five channel memberships. It identifies L102 as the cross-channel overlap and L101's second Search record as repeated activity. That is enough evidence to explain the difference without deleting valid data or modifying attribution rules.
Repair the smallest thing that is wrong
If the formula is correct but the label implies an additive total, change the label and add the overlap explanation. If filters differ, align them and repeat the fixture checks. If identifiers are damaged, fix the source or an explicitly approved normalization step. If the stakeholder actually wants primary-channel attribution, build that as a separate, clearly defined measure.
Before replacing the production version, have the report owner inspect the fixture and a permitted real-data sample. Check the same views after the change and record the definition in the report notes. Preserve a copy of the previous configuration so that an unexpected result can be compared and reversed without reconstructing every setting from memory.
Measure success by reproducible counts and fewer unresolved reconciliation questions, not by whether every displayed number adds neatly. Stop the release if the ID definition is disputed, the missing-ID population is unexplained, or a blended source changes the population in a way you cannot account for. Those are data-model decisions that a chart formula cannot settle.
Your next action is to run the six-row fixture in a test copy and check whether the overall distinct count is four. Then compare the production report's identity and filter rules. For related aggregation problems, see percentage totals calculated as a ratio of sums and inflated costs caused by blend join grain.
Weekly Newsletter
AI Adoption Weekly
New research, field guides, training studies, and tool decisions for operators.
No spam. Unsubscribe anytime.
Related Comparisons
Calculator
AI seat cost calculator
List price × headcount. You enter the hours and the operating assumptions.