
Check Beyond the First 1,000 Rows in Power Query
Check the full extract, preserve exceptions and reconcile row counts before treating a clean Power Query preview as approval to use the data.
Published November 15, 2026

A green column-quality bar in Power Query does not necessarily describe your complete file. The default profile covers the first 1,000 rows. Before approving an extract, switch profiling to the entire data set, check what the current query has already filtered out, and reconcile accepted records with a separate exception list.
That is a useful first check for a finance analyst who sees a clean preview but encounters errors during a later refresh. It also matters when an operations team uses the preview to approve a supplier file. A readable first screen is weak evidence about records farther down the extract.
Microsoft documents the default and the whole-data-set option in its Power Query profiling guide, checked November 3, 2026. The method below adds a business acceptance process around that feature. Its sample counts are constructed, not results from a customer workbook or a private product test.
Decide what the file must prove
Start with the business decision. A supplier master used to send purchase orders needs usable supplier identifiers and delivery details. A transaction extract used for a monthly total needs the correct population, amount types and reporting period. Those files can have different acceptable blanks even when both look equally green in the editor.
Write the acceptance rule before cleaning. For a transaction extract, it might be: every expected transaction ID is accounted for; each accepted record has a usable amount; negative amounts have an understood meaning; and unresolved exceptions remain visible to the reporting owner. This is more useful than an instruction to remove anything that produces an error.
Use this process if you can inspect the source, edit a test copy of the query and ask the source owner about questionable values. Skip the editor-only approach when you need continuous validation of a large operational feed. In that case, retain the same acceptance rules but have the data team implement repeatable checks in the production refresh path.
The prerequisites are access to the relevant Excel or Power BI environment, the original extract, its expected row count and someone authorized to decide which records belong in the report. Budget analyst time for full profiling, exception investigation and a complete refresh. Existing software and data-source charges still apply; this guide does not require buying another cleaning product.
Freeze the population before looking at percentages
Keep an unchanged copy of the source file and record its extraction time. If the source changes while you investigate, a difference in counts can come from a new transaction rather than a query defect. For a database source, ask the owner how to obtain a repeatable extract or a clearly bounded reporting period.
Record the expected count using the source's own definition of a record. A file with 2,400 transaction rows should not be compared with a count of 2,400 distinct customers. Keep the transaction ID if one exists. If there is no reliable ID, agree on a traceable combination of fields before correcting or excluding anything.
Open the query's applied steps and note where records disappear. Filters, joins and deliberate exclusions change the population being profiled. Entire-data-set profiling describes the result at the selected step. It does not bring back records removed earlier or prove that the source extraction included everything requested.
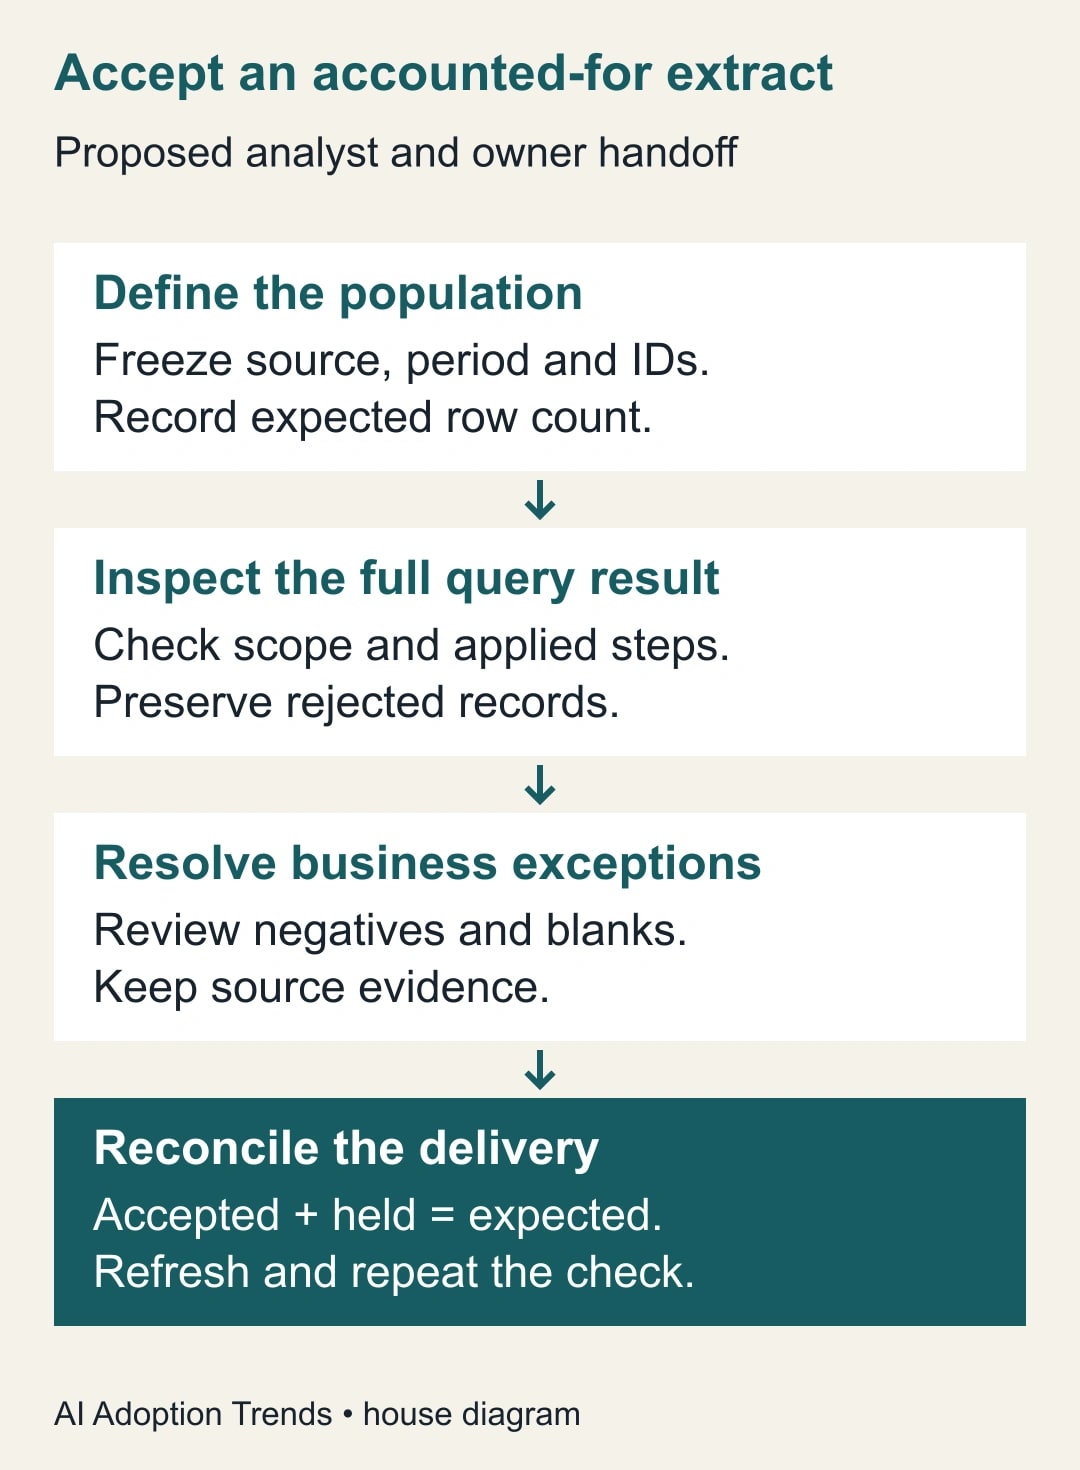
Make a simple count bridge: source rows, intentionally excluded rows, rows still in scope, accepted rows and held rows. Record reasons beside exclusions. If a filter removes 30 canceled transactions under an approved reporting rule, that is different from losing 30 records because an amount conversion failed.
Change the profiling scope, then inspect the right step
In Power Query Desktop, open View and enable the profiling tools in Data preview. Power Query Online exposes them under View, Data view. Select the lower-left message indicating profiling is based on the top 1,000 rows and change it to the entire data set. These locations are documented in Microsoft's profiling instructions.
Let the operation complete before recording results. A long-running or failed evaluation is an unresolved check. Do not describe it as a clean result because the previously visible bars looked good. If the complete evaluation is too expensive for the environment, ask the data owner to run equivalent full-population checks and record their scope.
Inspect the column after the transformation whose output you intend to use. A text column may be valid text even though some values cannot become amounts. Compare the step before conversion with the step after conversion, preserving the original value and source ID in your diagnostic copy. That comparison helps distinguish a bad input from an inappropriate conversion rule.
Microsoft separately documents that automatic type inference can use the first 200 rows. This is a different sample from the default 1,000-row profile. A type chosen from early records may be unsuitable later, and a wrong type can sometimes change values without producing an error. See Microsoft's explanation of type inference, checked November 3, 2026.
For that reason, changing the profiling scope is not a complete repair by itself. Check whether the chosen types fit the business meaning of each column. An identifier containing digits may need to remain text. An amount may require decimals even when the first rows contain only whole numbers. Ask the source owner when the intended representation is unclear.
Work through a 2,400-row extract
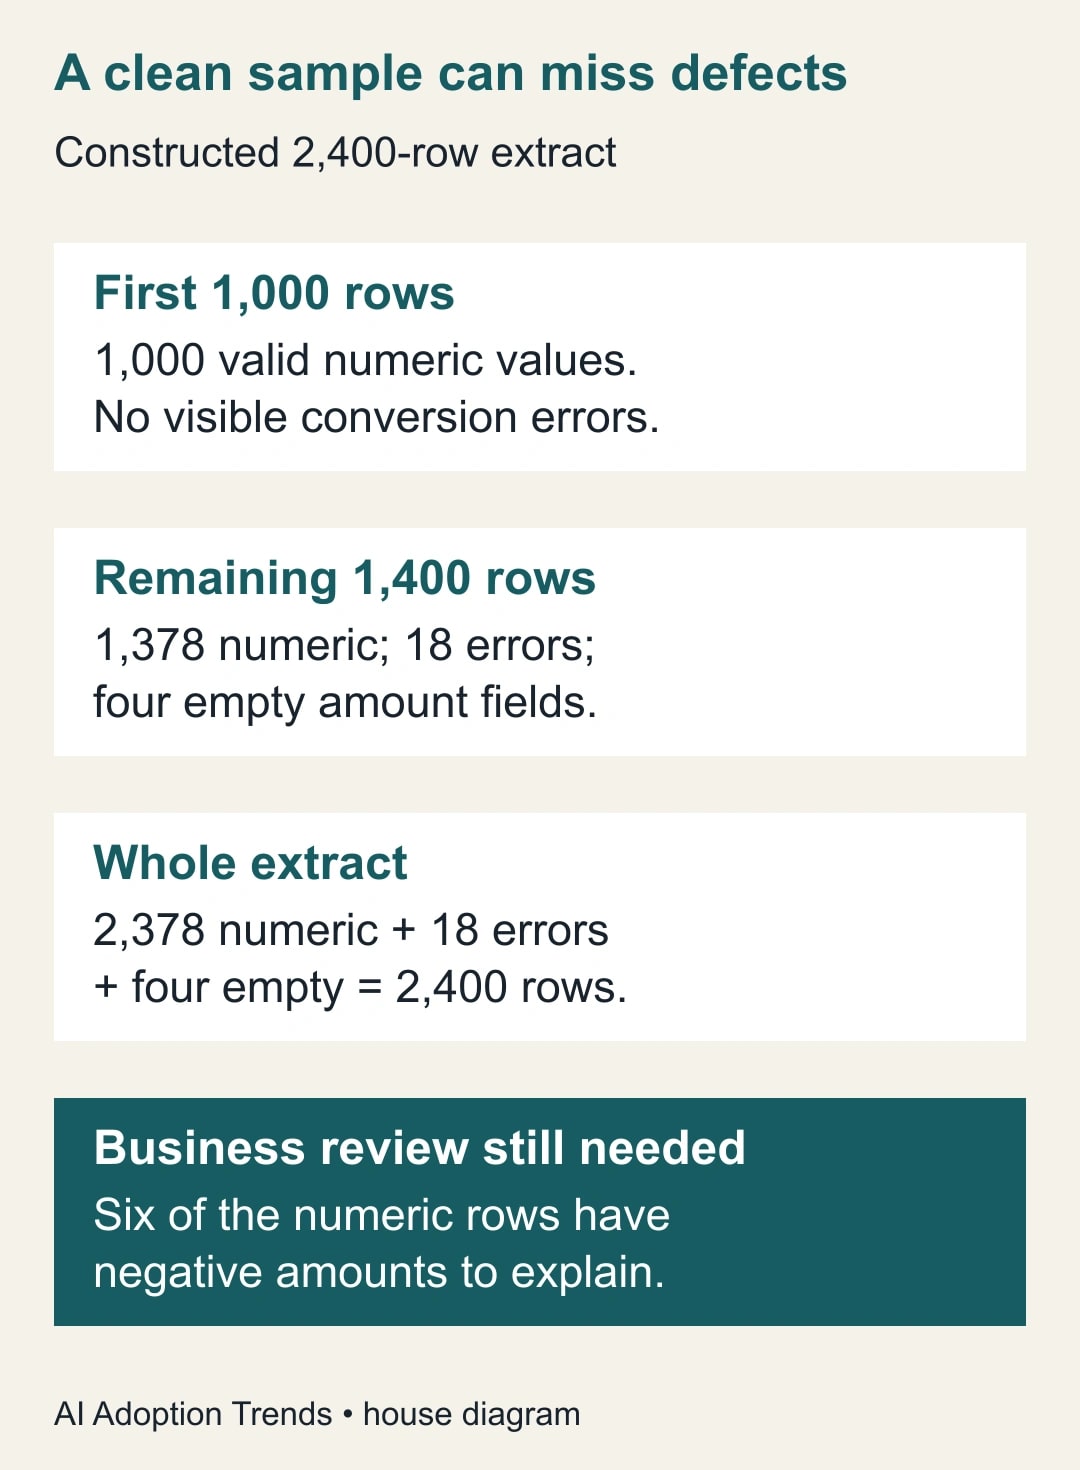
Imagine a constructed file of 2,400 transaction rows, each with a distinct transaction ID. The first 1,000 amount values convert successfully to numbers. In the remaining 1,400 rows, 1,378 convert, 18 contain text that produces conversion errors, and four are empty. No upstream filter has removed records in this example.
The default sample can therefore show no amount errors. Across the complete file, the accounting is 2,378 numeric values, 18 conversion errors and four empty values. Those counts add to 2,400. The error share is 18 divided by 2,400, or 0.75%; the empty share is about 0.17%. Use exact counts to reconcile the file because displayed percentages may be rounded.
Now add a business check. Six of the 2,378 numeric amounts are negative. A negative amount is a number, so numeric validity alone does not tell you whether it is a legitimate credit, a reversed transaction or an incorrect sign. The reporting owner must decide. Keep those six rows separate from the conversion-error count.
At the first review, the analyst accepts 2,372 ordinary numeric rows and holds 28 rows: 18 errors, four empty values and six negatives. The total remains 2,400. This is a conservative acceptance rule for the illustration, not a recommendation that every negative transaction should be rejected.
The source owner confirms that all six negatives are genuine credits and corrects 12 of the text errors from source evidence. Accepted rows rise to 2,390. Ten remain held: six conversion errors and four empty amounts. No row has been deleted merely to make the refresh succeed, and the owner can explain exactly what is absent from the proposed report.
Whether 2,390 accepted rows are enough depends on the reporting decision. A reconciliation that requires every transaction may have to wait. An operational dashboard may show a clearly labeled provisional result alongside the ten unresolved items. The business owner makes that choice; the analyst should not infer approval from the small percentage held.
Use an exception list that someone can resolve
For each held record, retain the source ID, original value, failing field, query step, reason for the hold and named owner. Add the intended treatment and the evidence supporting it when the issue is resolved. Keep corrected values distinguishable from the original source values.
Avoid replacing every conversion error with zero. That can turn missing information into an apparently legitimate amount and distort totals. Similarly, removing error rows may make the query load while leaving the business question unanswered. If exclusion is the agreed treatment, keep its count and reason in the reconciliation.
Group exceptions by cause before fixing them one at a time. A repeated currency label, mixed date convention or changed source export may have a common explanation. Correct a systematic transformation only after checking representative source records and the intended business rule. A broad replacement that fixes one example can damage another.
For missing columns, use the required-versus-optional column repair guide. That is a structural problem separate from the profiling scope. For repeated transaction IDs with different updates, use the latest-record selection method; a clean numeric column cannot establish which update belongs in the report.
Make the acceptance test harder to fool
Build a small test copy with a defect beyond row 1,000. Include one empty amount, one invalid amount and one valid negative credit. Specify the expected classification before refreshing. This checks whether the team is actually examining the full result and whether its business rules distinguish a credit from a conversion failure.
Move the same defective record near the beginning and repeat. The final acceptance decision should not depend on where the source happened to place it. If changing row order changes the result, investigate sampling, inferred types or an order-dependent transformation before trusting the production query.
Add a new valid row and confirm that it appears in the accepted count. Then remove a required field in a separate test copy and confirm that the process visibly stops or produces the intended exception. These mutations test both inclusion and failure detection. Keep them out of the live source and clearly label the test files.
Run the complete refresh path that the report will use. A manual editor inspection is useful evidence, but it is not the same as observing a scheduled refresh with its actual connection, permissions and source version. Record the loaded count and a few known IDs in the final destination as well as the editor result.
Reuse this acceptance worksheet
- Population: source name, extraction time, reporting period and expected record count.
- Identity: stable record ID and how duplicates or missing IDs are treated.
- Scope: selected query step, profiling mode and upstream exclusions.
- Types: intended meaning of each required field and any conversion rule that can change values.
- Quality: exact counts of numeric or otherwise usable values, errors and empty required fields.
- Business exceptions: negatives, impossible dates, duplicates or other values requiring owner judgment.
- Reconciliation: accepted plus held plus approved exclusions equals the source population.
- Evidence: source corrections, refresh result, destination count and reviewer approval.
Assign the analyst responsibility for reproducible checks and the source owner responsibility for explaining or correcting input. The report owner decides whether a provisional result is usable. Name a backup for unresolved exceptions so the process does not stall when one person is away.
Measure unresolved records and their age, refresh failures, unexplained count differences and time spent repairing recurring source problems. A lower error count is not progress if the query simply drops more records. Include excluded and held counts in the measure so improving appearance cannot substitute for improving the data.
Stop release when the population cannot be reconciled, a required value has been silently replaced, or the owner cannot explain a consequential exception. If full profiling is repeatedly too slow, move the checks closer to the source instead of quietly returning to a sample. The next action is small: take one current extract, confirm the profiling scope and write down the full-file count bridge before approving its totals.
Weekly Newsletter
AI Adoption Weekly
New research, field guides, training studies, and tool decisions for operators.
No spam. Unsubscribe anytime.
Related Comparisons
Calculator
AI seat cost calculator
List price × headcount. You enter the hours and the operating assumptions.