
Looker Studio Scheduled PDFs Show the Wrong Filters: A Repair Checklist
Repair scheduled Looker Studio PDFs by checking schedule filters, dates, recipients and a two-client control total before external delivery.
Published November 22, 2026

When a scheduled Looker Studio PDF shows different numbers from the report you were viewing, inspect the schedule’s own filters and date range first. Do not assume that your last interactive selection became the next email’s selection. Compare the delivered attachment with a small, known set of records before sending another client report.
Google’s current documentation, headed Data Studio, says scheduled PDFs initially use report defaults. You can edit schedule control values in the Filters tab. Later changes to a report’s default filter values do not update existing schedule values; removing a filter removes it from schedules too. That makes a report redesign a delivery change worth checking. This guidance was verified November 22, 2026. Read Google’s scheduled report delivery documentation.
This article uses Looker Studio in the title to match the reporting workflow many readers know; the linked current Google documentation uses Data Studio. The problem here is scheduled PDF delivery from that reporting product, not scheduling content in the separate Looker platform. The repair method below is an editorial recommendation with a constructed dataset, not a claim of testing a customer report.
Use it if you own recurring client, department or management reports. Skip schedule-level repair as a solution to fundamentally wrong source data, duplicate joins or missing access. Those problems need their own diagnosis. A correct schedule can faithfully export an incorrect report, so verify both the selected records and the calculation.
Preserve the evidence and contain the next send
Keep the unexpected attachment, delivery time, recipient list and report link in the approved reporting workspace. Record the exact discrepancy: wrong client, wrong dates, an extra page, a stale figure or a blank chart. “The PDF is wrong” is too broad to choose a repair. If you changed filters after opening the report, note that state separately from the attachment’s state.
Prevent another questionable delivery while you investigate. Record recipients, pages and cadence before changing anything. Google documents pausing for Pro and deletion as stop options; deletion is irreversible. Check the supported schedule controls.
If a report has already gone to an unintended audience, involve the accountable reporting owner immediately and follow the organization’s established response process. Correcting tomorrow’s filters does not retrieve an attachment already delivered. Preserve enough evidence to understand the scope without forwarding the mistaken report to additional people for convenience.
Compare three states, not two screenshots
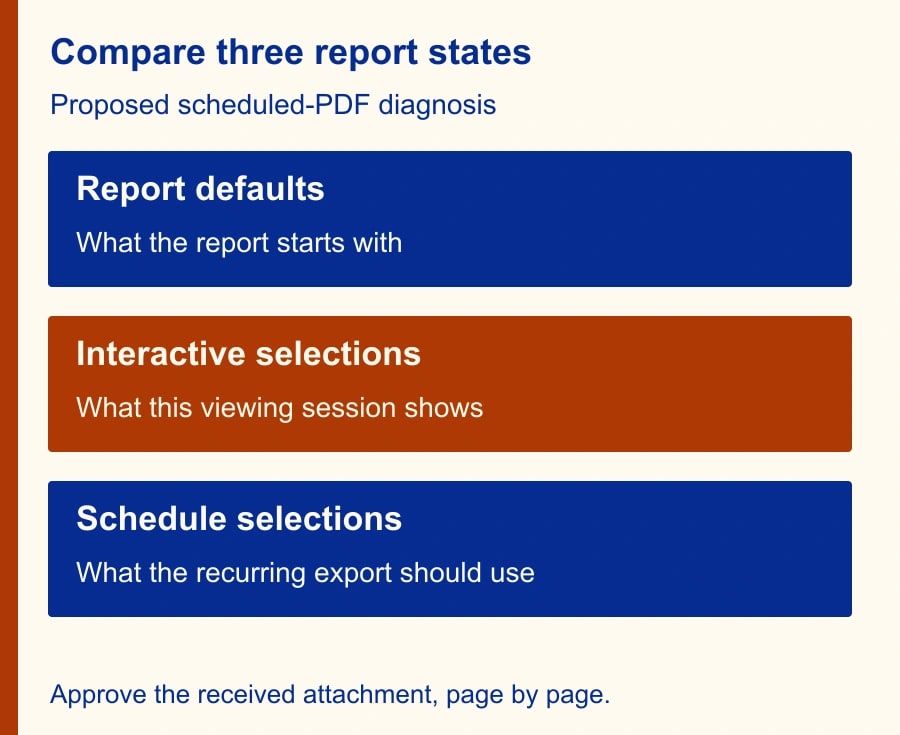
Write down the report defaults, the current interactive selections and the schedule selections as three separate records. The report you are looking at may reflect an exploratory filter you applied minutes ago. A screenshot of that view proves what was visible in that session, not what the schedule was configured to send at its last run.
For each state, list the client or department, date interval, selected pages and the metric definition. Include whether a date label means transaction date, lead-created date or another business event. Two reports can show the same calendar dates and still count different work if they use different date fields. The owner should define the intended coverage in business terms before the editor changes controls.
Then compare the attachment itself. Check every page, including the first-page preview visible in the email. A correct cover chart does not prove that a later table excludes another client. Read row labels, footnotes and date captions as well as the headline total. The attachment is the artifact your recipient may retain and forward, so it is the final object to approve.
Use a tiny two-client control dataset
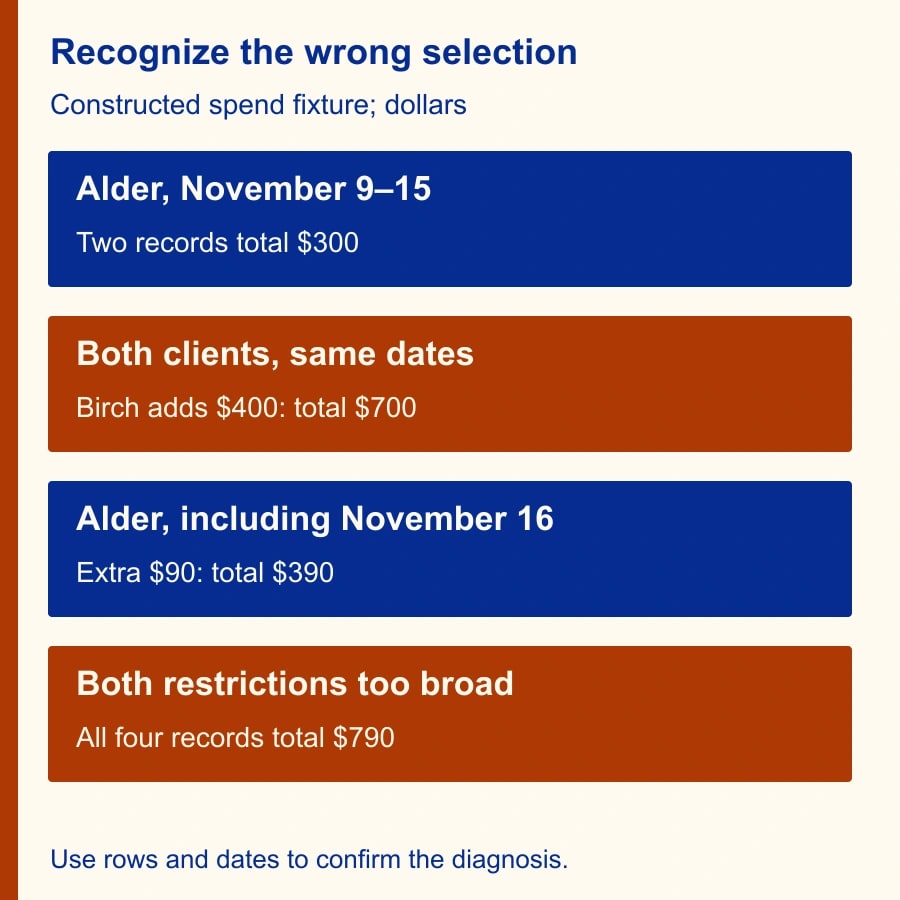
Here is a constructed example for an agency sending a weekly spend summary to Alder. The fixed reporting interval is November 9–15, 2026 inclusive. The example measures spend in dollars, with one row per client and date. It contains four records: Alder on November 9 at 120; Alder on November 15 at 180; Birch on November 9 at 400; and Alder on November 16 at 90.
For Alder during November 9–15, the expected amount is 300 from two rows. If the client filter is missing but the interval is correct, the result is 700 because Birch’s 400 is included. If the client is correct but November 16 is also included, the result is 390. If both restrictions are too broad, the total becomes 790. These signatures help identify a likely problem, but the IDs and dates still need inspection before concluding which filter failed.
Use synthetic names and a copied test report for the rehearsal. Do not mix fabricated records into the production dataset merely to make a test convenient. If a test copy cannot reproduce the relevant controls or data source arrangement, document that limitation and run a carefully approved check using known real totals with internal recipients only.
Create a simple table showing client, date and spend alongside the total. This gives the reviewer an explanation for the number. A single scorecard can hide an unwanted row. Once the fixture works, compare a small live slice with an independently checked source total before reopening the external schedule.
The control dataset is deliberately small enough to review by hand. It does not prove every chart on a complex dashboard is correct. Repeat the relevant checks for pages using different data sources, date fields or calculations. If one page ignores the client selection while another responds, investigate the report’s control scope and field configuration rather than assuming the email scheduler changed the arithmetic.
Repair the schedule, then test the delivered file
An authorized owner, editor or scheduler should edit the schedule’s Filters tab. It exposes filter and date controls; data controls and buttons are excluded. See the supported schedule filter instructions. Record the change and its expected effect before testing it.
Record the intended recipient set and selected pages before saving. If the schedule belongs to a group alias, ask its owner to confirm membership through the normal process. An alias that was appropriate last quarter may now include someone outside the reporting audience. Do not treat a familiar address as evidence that every current member should receive the attachment.
Test through the actual delivery route to approved internal recipients. Pro supports Send now for eligible reports; where that is unavailable, use a permitted scheduled test and allow time for it to arrive. A manual download can help inspect layout, but it is not evidence that the schedule’s recipient list, controls and delivery timing are correct. Avoid buying Pro solely to skip this verification wait without a separate business reason.
Open the received PDF and compare the fixture’s rows, totals, dates and page count. Record the send time and whether the attachment matches the approved configuration. If it fails, keep external distribution stopped and change one variable at a time. Repeatedly editing filters, data sources and date logic together can erase the clues that identify the original fault.
Treat credentials and recipients as separate controls
Google distinguishes data-source owner credentials from viewer credentials. Owner credentials can let report viewers see data without having their own access to the underlying dataset; viewer credentials require that access. These are source-access arrangements, not a reason to trust an arbitrary email audience. Google’s data credentials explanation describes the difference.
A client filter is a reporting selection and should not be your only confidentiality control for a multi-client system. The system owner needs to decide whether the data architecture and sharing arrangement actually enforce the intended boundary. Do not widen source credentials to repair a blank export until you understand whose authority the export uses and what information would become accessible.
If the report was recently transferred to another person, check ownership and credentials before changing the numbers. An employee departure can create a delivery problem that looks unrelated to the schedule’s filter values. Use our guide to Looker Studio ownership transfers and data credentials for that separate diagnosis, then return to the delivered-file test.
Check freshness after you confirm the selection
If the client and dates are right but the total remains old, compare the latest available source records with the report’s data. Google documents connector-dependent freshness settings that balance current data, performance, query costs and quotas. Extracted sources are a separate case. Do not assume that scheduling an email forces every upstream system to finish loading first. Review Google’s data freshness guidance.
Write down when the source is expected to be complete and when the report is due to send. A sensible delivery time follows the business’s data-completion point with room for verification. If the source sometimes arrives late, choose an agreed fallback: delay the report, label the coverage as incomplete with the owner’s approval, or use the previous confirmed period. Do not silently present a partial day as final.
For a weekly report, a fixed historical interval is useful during diagnosis because it removes the moving boundary from the test. After the repair, restore the intended rolling or recurring date behavior and test that transition too. The objective is a repeatable schedule, not a single correct attachment produced by hard-coding last week forever.
Maintain a schedule change register
- Report and schedule owner: identify who can change the schedule and who approves external delivery.
- Audience: record recipients or group owner and the business reason for each destination.
- Coverage: list client or department, business date field, interval rule and selected pages.
- Controls: record the schedule values and any report defaults that differ from them.
- Source readiness: record the expected data-completion time and the late-data fallback.
- Control totals: keep a known slice with expected rows and amounts for regression checks.
- Change triggers: recheck after deleting controls, changing defaults, replacing sources, transferring ownership or adding pages.
- Delivery evidence: record the actual attachment check, reviewer, date and decision to resume.
This register is useful even if there is only one schedule. It explains what the recurring export promises its audience. When a colleague changes a report for interactive analysis, the register makes it easier to see whether the change also requires a delivery review. A copied report is not automatically a verified replacement for the old schedule.
Decide whether automation is still worthwhile
The prerequisites are access to the report, authorized scheduling capability, an approved recipient set and a source you can reconcile. The operational cost includes review time and any connector or query charges already associated with the report. This guide does not quote plan prices because the repair should begin with the existing schedule and entitlement, not a speculative upgrade.
Measure exceptions and rework over several deliveries. In a constructed example, manually preparing four reports at twenty minutes each takes eighty minutes. A schedule that still needs five minutes of checking per report plus twenty minutes of monthly maintenance takes forty minutes. The potential release is forty minutes before one-time setup. It is not cash savings unless actual spending changes, and one misdirected client attachment can outweigh a modest time benefit.
Keep the schedule stopped if audience boundaries remain uncertain, the fixture does not reconcile or source completion is unpredictable without a usable fallback. Start again with one internal delivery and the two-client control totals. If the dates and audience are right but distinct lead totals still disagree, use the guide to counting unique leads without adding overlapping row totals before approving the next external report.
Weekly Newsletter
AI Adoption Weekly
New research, field guides, training studies, and tool decisions for operators.
No spam. Unsubscribe anytime.
Related Comparisons
Calculator
AI seat cost calculator
List price × headcount. You enter the hours and the operating assumptions.