
Use Copilot in Excel to Explain Sales Variances You Can Check
Build a checked sales comparison, separate quantity and price effects, and turn the result into useful questions for account owners.
Published October 13, 2026

Use Copilot in Excel to prepare a sales-variance explanation only after the workbook can reproduce the totals you trust. Ask it to separate quantity and price changes, show the formulas, and identify the rows behind each conclusion. Keep the original data untouched. The useful result is a manager knowing which product or customer needs attention, not a confident paragraph about why revenue moved.
This guide is for a sales operations manager or business owner who already receives a monthly product-sales export. It walks through a constructed two-product example, a reusable workbook layout, and prompts that make the arithmetic reviewable. It does not assume you have tested Copilot or that every Excel account has the same features. Product documentation was checked on October 13, 2026.
Skip this approach if the underlying sales report is still disputed, currencies are mixed without an agreed conversion, or the decision requires accounting judgments the sales team cannot make. Resolve those inputs with the responsible owner first. If a stable PivotTable and a short formula already answer the question, keep them. AI is useful for preparing and explaining the analysis, not for replacing reliable arithmetic with a plausible story.
Confirm the environment before touching the live workbook
Check that Copilot appears in your approved work version of Excel and that you can use the mode needed for the task. Microsoft's Copilot in Excel FAQ identifies license, application, network, and privacy requirements and notes that access varies by account configuration. Confirm entitlement with your administrator; do not assume a consumer subscription is appropriate for company records or that an additional license is automatically necessary.
Create a review copy with an obvious name and date. Microsoft says in its Excel tips that Copilot can make direct workbook changes and that AutoSave may be on or off. For a trial, protect the authoritative file and check how your copy is saved. Know how to undo an edit or return to a previous version before asking for broad changes.
Budget for more than access to the feature. Someone must prepare the export, resolve product identifiers, check the formulas, and approve the commentary. Start with a small monthly report rather than connecting several live systems. A first trial can use invented records in an already approved environment; do not upload customer-level detail unless it is necessary and permitted for the task.
Define exactly what revenue means in this report
Write a one-paragraph measurement note above the data. Identify the two periods, currency, treatment of returns and credits, whether taxes and shipping are included, and the source report. State whether the values represent orders, invoices, recognized revenue, or cash received. Those are different business measures. A sales manager should not label booked orders as recognized revenue merely because the spreadsheet header says Sales.
Use one row per product and period in the simple example. Include product ID, period, quantity, and net sales amount. Calculate average realized unit price as net sales divided by quantity where quantity is nonzero. If the source includes returns, bundles, free units, or negative quantities, ask the report owner how to represent them. An average price can conceal a product-mix change; the purpose here is to explain the arithmetic, not automatically diagnose customer behavior.
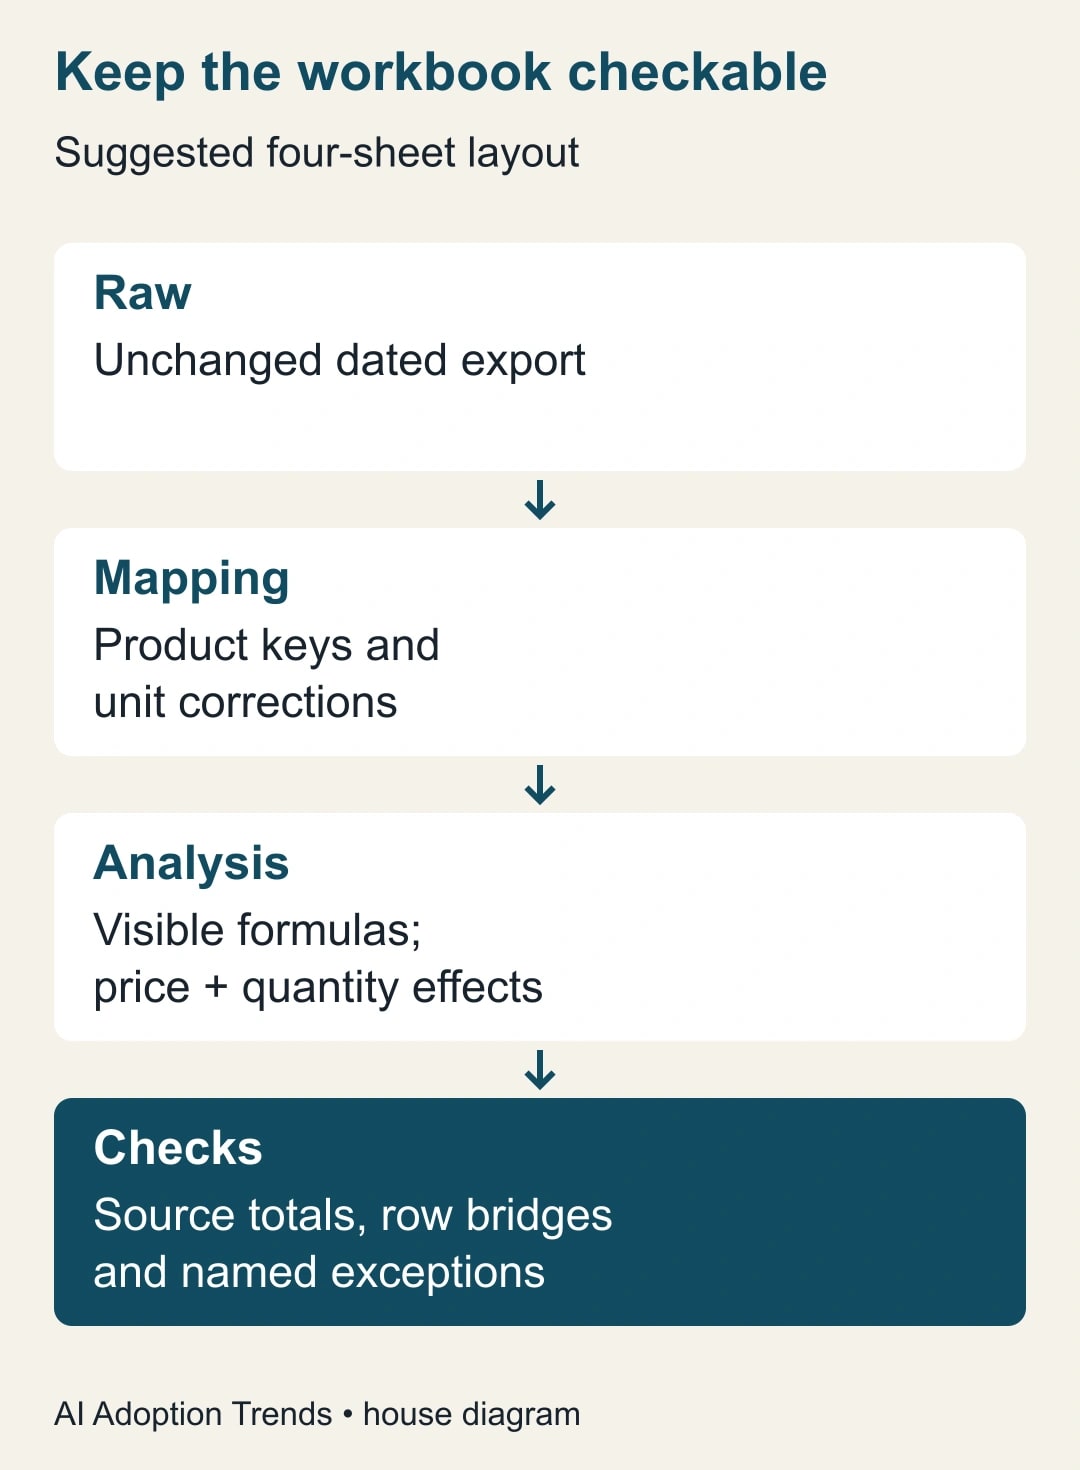
Keep a Raw sheet for the unchanged export, a Mapping sheet for product-name corrections, an Analysis sheet for calculations, and a Checks sheet for reconciliation. This is our suggested layout, not a Copilot requirement. The separation lets the reviewer see whether a cleaner-looking result came from a valid calculation or an unrecorded alteration of source data.
Start with a tiny example whose answer is known
In the constructed example, Product A sold 100 units at an average of $50 in September, producing $5,000. In October it sold 120 units at $48, producing $5,760. Product B sold 50 units at $100 in September, producing $5,000; in October it sold 40 units at $110, producing $4,400. All figures are invented to demonstrate the method, in one currency, with no returns or taxes.
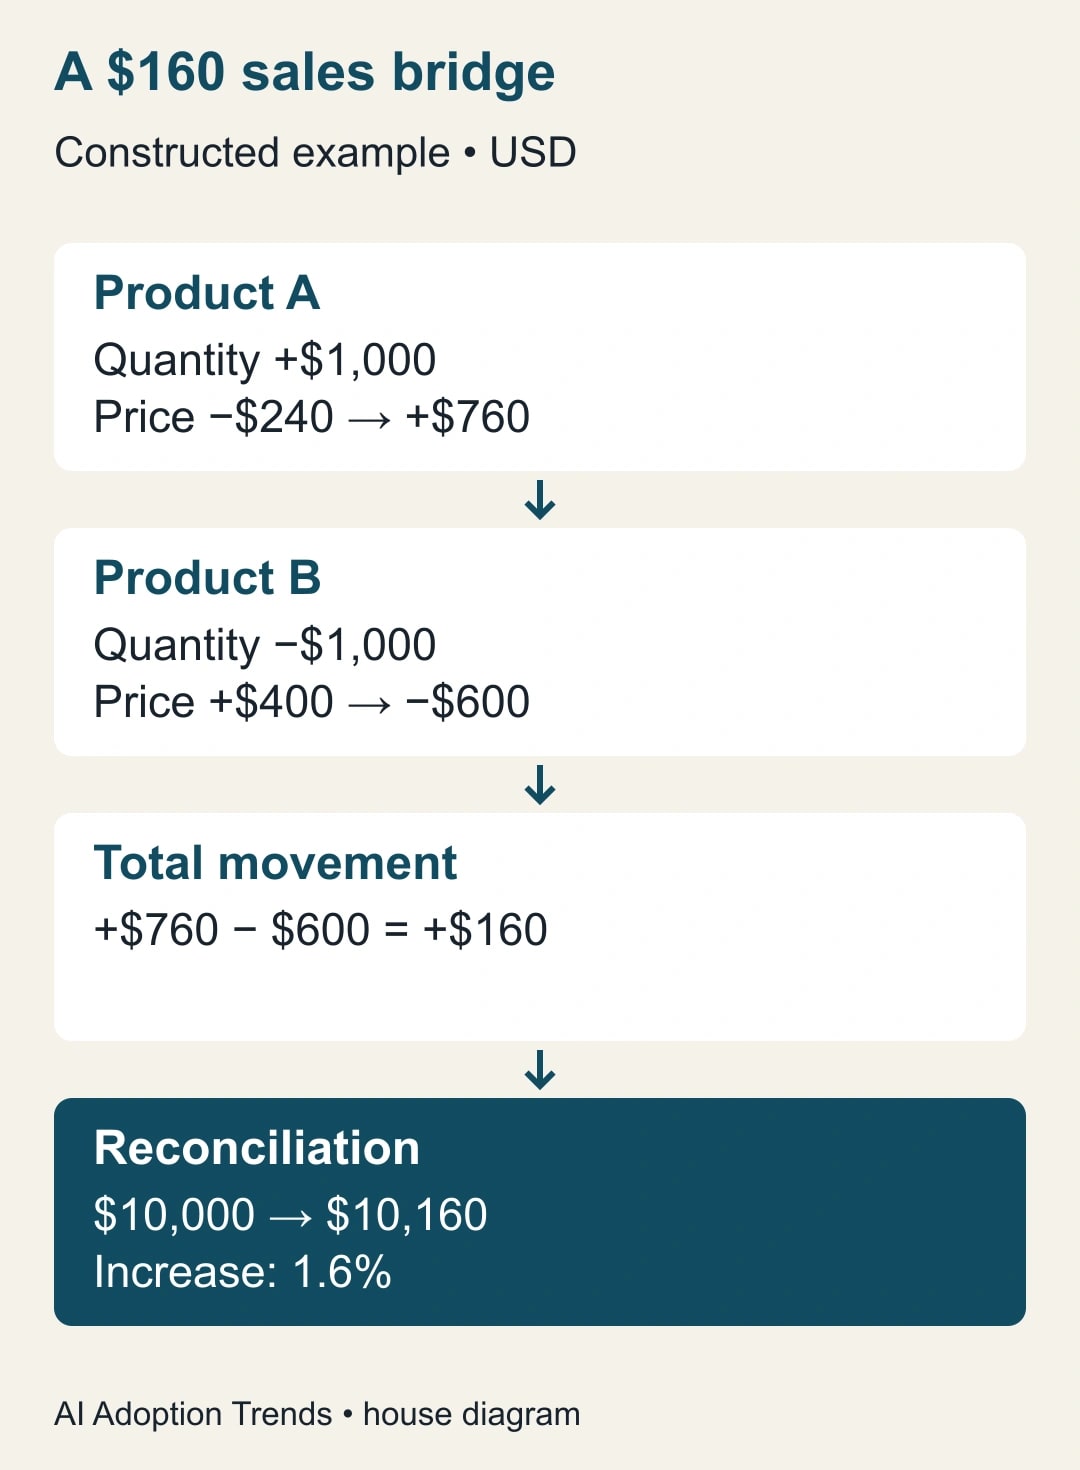
September sales total $10,000. October sales total $10,160. The increase is $160, or 1.6% of the September total. That modest gain combines a $760 increase for A with a $600 decline for B. A paragraph saying “sales improved across the range” would be wrong even though the total increased. The product-level check keeps that mistake visible.
Ask Copilot: “Using only the Raw sheet, build a product comparison on a new Analysis sheet. Show September quantity, September average price, October quantity, October average price, sales for each month, and the change. Use formulas rather than hard-coded answers. Leave Raw unchanged. Identify missing products or zero quantities before calculating a percentage. Show the grand totals and explain any difference from the source export.”
Inspect the proposed or completed changes in your available Excel experience. Do not approve a broad rewrite simply because the preview looks tidy. Confirm that the four source rows remain unchanged and that the calculated sales are $5,000, $5,760, $5,000, and $4,400 for the respective product-period combinations. If those do not match, stop before requesting an explanation.
Separate the quantity effect from the price effect
Choose a method and state it. For this guide, quantity effect equals the change in quantity multiplied by the old average price. Price effect equals the change in average price multiplied by the new quantity. Adding those two effects exactly explains the revenue change for each product. Using new quantity in the price effect assigns the interaction between price and quantity to that component; another valid convention can allocate it differently.
For A, the quantity effect is (120 minus 100) multiplied by $50, or positive $1,000. The price effect is ($48 minus $50) multiplied by 120, or negative $240. Together they explain the $760 increase. For B, the quantity effect is (40 minus 50) multiplied by $100, or negative $1,000. The price effect is ($110 minus $100) multiplied by 40, or positive $400. Together they explain the $600 decline.
Across both products, quantity effects net to zero and price effects net to positive $160. That does not mean quantity was unimportant. Product A's growth offset B's decline under this convention. It also does not prove that changing prices caused customers to buy more or less. Promotions, customer mix, availability, and timing could all contribute. The workbook explains the numerical movement; the manager investigates the cause.
For a simple sheet, put old quantity in B, old price in C, new quantity in D, and new price in E. Row 2 formulas are old sales =B2*C2; new sales =D2*E2; quantity effect =(D2-B2)*C2; and price effect =(E2-C2)*D2. The check is new sales minus old sales minus both effects, which must equal zero before rounding. Use the actual cells for those outputs in your workbook.
Ask Copilot to add these formulas and then inspect several rows yourself. New products lack a prior price and discontinued products may lack a current one. Put them in explicit new-product and discontinued-product categories instead of forcing the comparison through invented prices. Keep currency translation and returns as separately explained items when they require a different method.
Reconcile before writing the story
The Checks sheet should answer four questions. Do period totals match the original export? Does the sum of product changes equal the total change? Do the quantity and price effects reproduce each product's change? Are exceptions visible rather than silently dropped? A zero overall difference is necessary, but it can conceal offsetting row errors, so inspect individual products as well.
Use unrounded values for the calculations and round only the display. A report that calculates from rounded prices may create small unexplained differences. If a difference remains, record it and investigate the source rather than hiding it in an “other” line. An other category is useful only when it represents identified items with an owner and an explanation.
Check for duplicate product-period rows, changes in units of measure, and mismatched periods. A pack of ten and a single unit cannot share one quantity column without a conversion. A late credit may explain why the source report changed after the first export. Preserve the extraction date so a later comparison is not mistaken for an error in the analysis itself.
If Copilot proposes importing outside data, decide whether it is needed for the question. Microsoft's data-source guidance for Excel describes retrieval from the web and internal sources. For this first reconciliation, keep to the approved export. Broader context belongs in a separately sourced investigation after the core numbers agree.
Turn the result into an action, with uncertainty intact
Now ask for commentary: “Draft a 150-word sales-manager note using the checked Analysis sheet. State the total movement, the largest positive and negative product contributions, and the quantity and price effects under our stated method. Cite the relevant cells. Separate arithmetic from possible explanations. Do not claim a cause without evidence. End with two questions for the account owners, not a recommendation to change prices.”
An acceptable note would identify the $160 total increase, A's $760 gain, and B's $600 decline. It would ask why B sold ten fewer units and why A's realized price fell by $2. The owners might investigate lost availability, different customer discounts, or a one-off order. The note should not decide which explanation is true from two monthly rows.
Keep the final action register separate from the analysis. For each question, record the owner, evidence needed, due date, and decision it could change. The sales lead might ask the account team to identify B's missing orders; the pricing owner might check A's discount approvals. This makes the workbook useful at the next meeting instead of turning it into another report people acknowledge and forget.
A reusable monthly review checklist
- Before analysis: preserve the export; identify currency, periods, sales definition, returns treatment, product key, and units; agree who resolves exceptions.
- Before commentary: match source totals; inspect sample formulas; reconcile product changes; separate new and discontinued products; review every unexplained difference.
- Before sharing: verify all numbers in the text against cells; label hypotheses; attach the approved workbook version; assign the two most consequential follow-up questions.
- Before repeating: record corrections, update the mapping rules, and retain the same calculation convention so a method change does not masquerade as business movement.
Measure the trial by time to an accepted report, reconciliation errors, and whether the manager receives a useful action list. In a hypothetical baseline, a monthly report takes 90 minutes. Copilot reduces preparation to 35 minutes, but checking and corrections require another 40. The net release is 15 minutes, not 55. If setup took two hours, eight similar monthly cycles would recover that time, assuming the gain persists.
Stop the trial if the process changes source records, hides unresolved differences, or repeatedly produces causal claims unsupported by the data. Restore the review copy and use the existing formula or PivotTable process while the owner repairs the instructions. The best outcome may be a reliable workbook template with AI used only for a first commentary draft.
For the next monthly meeting, run this two-product example first and confirm the $160 bridge by hand. Then try a small approved slice of your own report. The Copilot beginner guide covers the broader learning path, and the AI business-case worksheet approach helps decide whether the measured improvement warrants a larger rollout.
Weekly Newsletter
AI Adoption Weekly
New research, field guides, training studies, and tool decisions for operators.
No spam. Unsubscribe anytime.
Related Comparisons
Calculator
AI seat cost calculator
List price × headcount. You enter the hours and the operating assumptions.