
Anthropic After the IPO: How to Judge Durable AI Demand
Anthropic has closed its IPO. Read its retention figures carefully, test repeat customer spending, and separate market expectations from useful AI demand.
Published November 21, 2026

Anthropic's IPO is complete, but a business buyer should judge its staying power by repeat, useful customer spending. The most revealing question is whether existing customers keep paying for work they want to continue, across enough customers to make that demand resilient. A rising share price cannot answer that question. Neither can a spectacular retention percentage on its own.
This is Day 2 of our 14-day Anthropic IPO series, updated November 21, 2026. It is for finance leaders, technology budget owners and readers trying to connect the AI market to business demand. If you need the financing arithmetic, start with our explanation of Anthropic's IPO proceeds and buyer implications. Today's decision is how much confidence to place in continued customer spending, not what price to pay for the shares.
The offering closed; the market's confidence remains unsettled
Anthropic's November 20 announcement confirms that the offering closed, including the underwriters' full additional-share option. It reports approximately $91.6 billion in gross IPO proceeds received by the company and a separate approximately $26 billion private placement. These are financing amounts before relevant deductions, not sales to customers or a valuation. The closing resolves an uncertainty in yesterday's analysis. Anthropic's closing announcement supplies the transaction details.
The trading signal moved the other way. Reuters reported that the shares closed Friday, November 20, at $88.91, down 8.5% from Thursday's close, compared with an $83 offering price. Those are three different reference points. Friday's closing price is the dated market observation here; it is not a live Saturday quote. Reuters' November 20 market report also describes the broader technology selloff.
David Miller, chief investment officer at Catalyst Funds, told Reuters: “Investors still believe in AI but are becoming more selective about what they will pay for that growth.” That is an investor's interpretation, not evidence that customers cancelled contracts on Friday. It identifies the distinction worth carrying into next week's decisions: demand for a product and the price investors assign to its future are different things.
Our reading is that the listing has moved the discussion from whether Anthropic can raise public capital toward what operating evidence will justify expectations. A market can lower the price it assigns to future earnings while a company's sales keep growing. Equally, a successful financing can buy time without proving that every customer deployment earns its keep. Buyers need their own evidence between those two possibilities.
Read the retention definition before the headline number
Anthropic's final prospectus reports approximately 900% net revenue retention as of September 30, 2026. It compares revenue from qualified customers in the latest three months with revenue from those same customers in the three months ending a year earlier. Qualified customers generated at least $1 in the base period; Claude Pro, Max and Ultra subscribers are excluded. The filing calls this a measure of “customer expansion, contraction, and churn.” These are company-reported metrics, not independently verified operating results. Read the final prospectus's definitions and metric limitations.
Net revenue retention measures spending retained from an existing customer group, including increases and decreases. Customer retention measures how many customers remain. A company can lose customers and still report very high revenue retention if the remaining accounts expand enough. It is therefore a mistake to translate a dollar-based percentage into the share of customers who stayed, or into a typical customer's return on investment.
The time periods matter, too. Compare the same length of period and the same eligible group. Dividing this month's revenue by last year's full-year revenue produces a number, but not a useful retention measure. Adding newly won customers to the current-period total would also answer a different question: how the whole business grew, rather than how an existing group behaved.
For a business reader, the next question after a large retention figure should be distribution. Did spending rise across many accounts, or did a few customers expand dramatically? Neither pattern is automatically bad. Broad growth suggests more businesses have found repeatable uses. Concentrated expansion may show an important product breakthrough, while making the next period more dependent on a small set of decisions.
A ten-customer example shows what an average conceals
Consider a constructed software supplier with ten customers, each spending $10,000 in a base quarter. Its starting revenue from that group is $100,000. In the comparable quarter a year later, two customers have stopped spending, six still spend $10,000 each, and two now spend $60,000 each. No new customers enter this calculation. This is an illustration, not an estimate of Anthropic's customer behavior.
The supplier now receives $60,000 from the six unchanged accounts and $120,000 from the two expanding accounts, for $180,000 in total. Revenue retention is $180,000 divided by $100,000, or 180%. Customer retention is eight remaining customers divided by ten original customers, or 80%. The two expanding accounts generate two-thirds of the current group's revenue, about 66.7%.
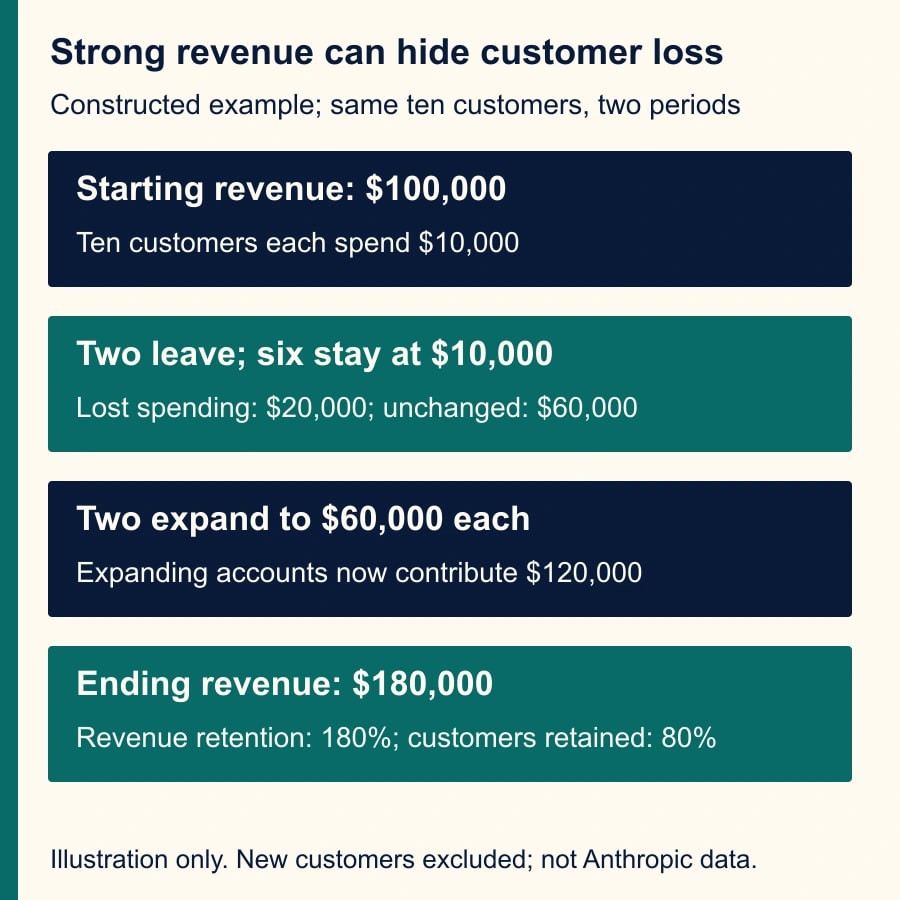
The revenue change can also be reconciled directly: start with $100,000, subtract $20,000 lost from departing accounts, and add $100,000 of expansion from the two growing accounts. That produces the same $180,000. This reconciliation is useful when a presentation mixes new customers, expansion and renewals into one growth story.
All three observations can be true: spending grew strongly, some customers left, and the remaining revenue became concentrated. A sensible analyst would ask what the two expanding customers deployed, whether the work continued after a trial, and what caused the two departures. The headline percentage alone cannot distinguish a durable process improvement from a temporary burst of experimentation.
There is a favorable interpretation. Perhaps those two customers moved a successful workflow into daily production and the others have room to follow. There is also a weaker interpretation. Perhaps they ran expensive short-lived projects while the departing accounts found cheaper substitutes. The next evidence should distinguish those explanations, rather than choosing whichever story matches the share-price move.
Concentration tells you where to ask the next question
The final prospectus reports that Anthropic's top five customers represented approximately 25% of revenue for the nine months ended September 30, 2026; no single customer represented more than 10%. It also says many leading customers can reduce spending or have contracts approaching expiration. Separately, it reports more than 11,900 customers generating at least $100,000 of trailing twelve-month revenue as of September 30. These disclosures use different periods and measures; they should not be combined into one concentration calculation.
Our inference is that both breadth and dependence deserve attention. A large customer count does not eliminate exposure to a few important accounts. Nor does concentration establish that demand is artificial. A supplier can win significant customers because it solves difficult work well. The practical issue is how much its growth story changes if one of those customers pauses, optimizes or redirects spending.
Public information may not reveal the specific workflows or renewal choices behind every large account. Record that as an unknown. Do not fill the gap with assumptions about named customers, motives or contract obligations. A useful monitoring note can say, “We need comparable-period concentration and repeat-spending evidence,” without pretending to know which account will expand next.
Build a demand worksheet from work your team can observe
A business buyer cannot reconstruct a public supplier's customer base from the outside. It can test whether its own spending is evidence of durable adoption. Assign one finance analyst and the workflow owner to a short review. As a planning allowance, reserve two hours for an initial pass if invoices and work records are already accessible; that is a suggested time budget, not a measured implementation result. A spreadsheet is sufficient, with no new analytics subscription required.
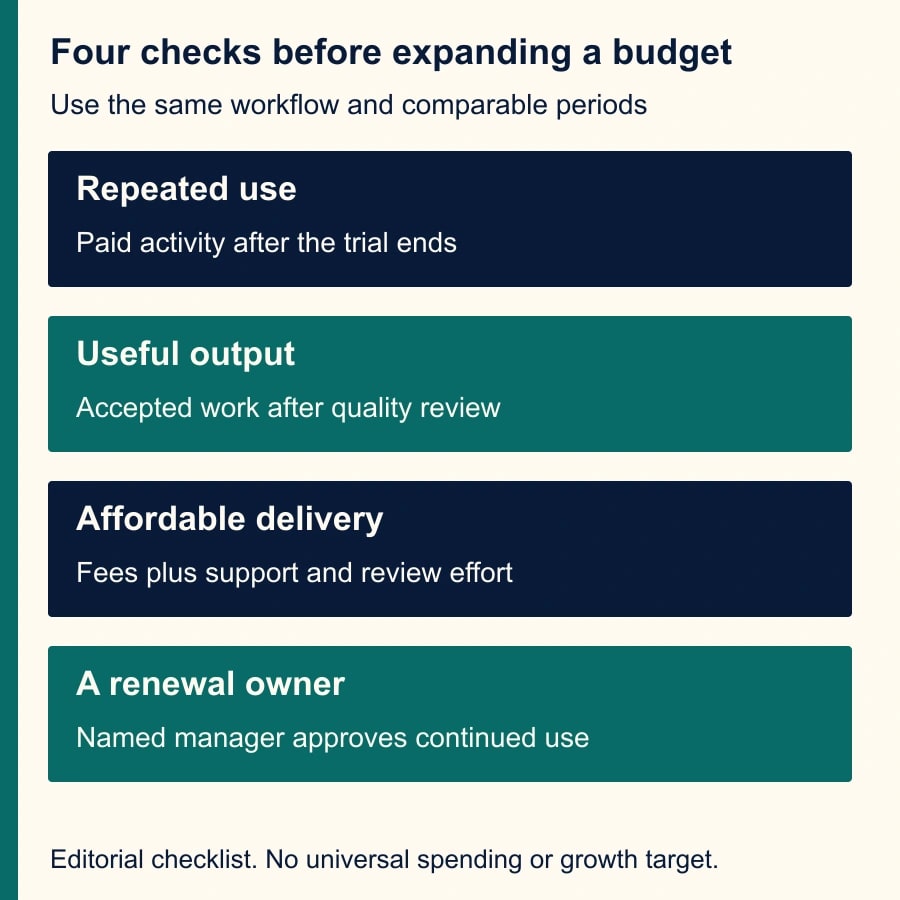
Bring three comparable completed billing periods, the relevant invoice lines, usage records, trial-credit details and a sample of completed work. Use a workflow with a clear output, such as reviewed support replies or approved internal reports. Keep the definition of an acceptable output consistent. If the records cannot connect spending to a particular workflow, begin by fixing that allocation rather than calculating a precise-looking return.
Copy this worksheet into the next budget review:
- Workflow and owner: name the work, responsible manager and decision date.
- Comparable periods: list start and end dates, working days, relevant seasonal changes and whether each period includes a trial.
- Paid activity: record invoiced fees and usage quantities separately; identify credits, prepaid balances and unpaid amounts rather than treating them as interchangeable.
- Useful output: count completed items accepted after review and record why other items failed.
- Delivery effort: record human review, correction and support hours alongside tool fees.
- Repeat demand: identify which teams continued, expanded, reduced or stopped use, and the reason given by each owner.
- Decision: continue, expand within a named limit, repair a specific problem, or stop; assign the next checkpoint.
Expected output is a one-page explanation of what changed, with supporting invoices and work samples. The checkpoint is whether another manager can reproduce the counts. A dashboard that shows more activity without identifying accepted work is not yet enough to justify expansion. Preserve the underlying records so next month's comparison does not depend on someone's memory of a good pilot.
For example, a team might double its automated draft volume while accepted outputs remain unchanged because reviewers reject the additional drafts. That is more supplier usage without more useful delivery. The owner should first inspect rejection reasons and the extra review burden. Expanding the budget before resolving that problem would reward the wrong measure.
A different team might cut its bill while completing the same accepted work with less review. Lower supplier revenue from that team could reflect a successful adoption decision. This is why a buyer should not borrow a supplier's growth target as its own success measure. The buyer wants useful work at an acceptable total cost; the supplier wants a business that can profitably serve that demand.
Where the worksheet can mislead, and how to recover
First, credits can obscure willingness to pay. Mark trial-supported periods explicitly and inspect the first comparable period after the subsidy ends. If no paid period exists, keep the finding as a pilot result. Do not extrapolate it into a renewal claim. The owner can approve a small paid test with a spending limit before making a larger commitment.
Second, changes in the work mix can make a comparison unfair. A month dominated by short routine questions should not be compared directly with a month of complex customer disputes. Separate a stable category of work or explain the mix change. If the sample is too small to support a conclusion, extend observation instead of assigning a confident percentage to it.
Third, review hours are easy to overlook. Ask reviewers to record correction and escalation work during a representative sample, not just the time needed to generate an answer. Released staff time is capacity. It becomes cash savings only when an actual spending decision changes. Avoid adding a theoretical wage saving to a second estimate that already counts the same hours.
Finally, automated summaries can lose the reason a team stopped using a tool. A cancellation caused by poor output quality calls for a different response from one caused by a completed seasonal project. Have the workflow owner confirm those explanations. Human judgment belongs at that point, and at the decision about whether an accepted output met the business's standards.
Pause expansion if quality falls below the team's existing acceptance requirement, if spend cannot be reconciled to invoices, or if no manager owns the outcome. Resume after the failed check is repaired and a new comparable sample passes. Stop the workflow if repeated repair attempts cannot produce acceptable work within its agreed budget. These are operating decisions the business can control, regardless of the stock's next move.
What this means for the market and the future of AI
The strongest case for durable AI demand is repeated purchasing attached to useful work. If that spreads across customers and survives ordinary budget reviews, investors have firmer evidence than launch attention. The skeptical case is that a portion of growth represents experimentation, concentrated spending or activity whose business value has not caught up. Both remain hypotheses to test through comparable operating evidence.
Efficiency complicates the picture. In another constructed example, suppose the price per unit of a service falls 20% while paid volume rises 40%, with everything else unchanged. Revenue becomes 0.8 multiplied by 1.4, or 1.12 times the starting amount: 12% growth. Cheaper service and rising supplier revenue can coexist. If volume rose only 10%, revenue would instead be 0.88 times the starting amount, a 12% decline. Neither calculation says anything about profit without delivery costs.
For the future of AI, that distinction matters more than a simple equation between higher spending and greater progress. Better systems could make established work cheaper, open new uses, or consume more resources without enough added value. Which outcome dominates depends on what customers keep using and paying for after the excitement passes. Our editorial judgment is that repeat accepted work is the most useful bridge between a technology claim and a business decision.
For your next review, choose one existing AI workflow and complete the worksheet with its owner. Record what would justify another period of spending and what would make you stop. Keep financing questions in the series' IPO cash analysis, and use this demand test to decide whether your own adoption is becoming a durable part of the business.
Weekly Newsletter
AI Adoption Weekly
New research, field guides, training studies, and tool decisions for operators.
No spam. Unsubscribe anytime.
Related Comparisons
Calculator
AI seat cost calculator
List price × headcount. You enter the hours and the operating assumptions.